

Ripping wax will always be fun. Understanding the math behind it just makes you sharper.
With each release, Topps drops an odds sheet and the hobby gets to work. Print runs get estimated. Dollar-per-parallel math gets shared. Case hit debates follow.
That process has real value. It helps collectors understand the scale of a release and the true rarity behind the checklist.
The Wax Value Index is our way of taking that work one step further.
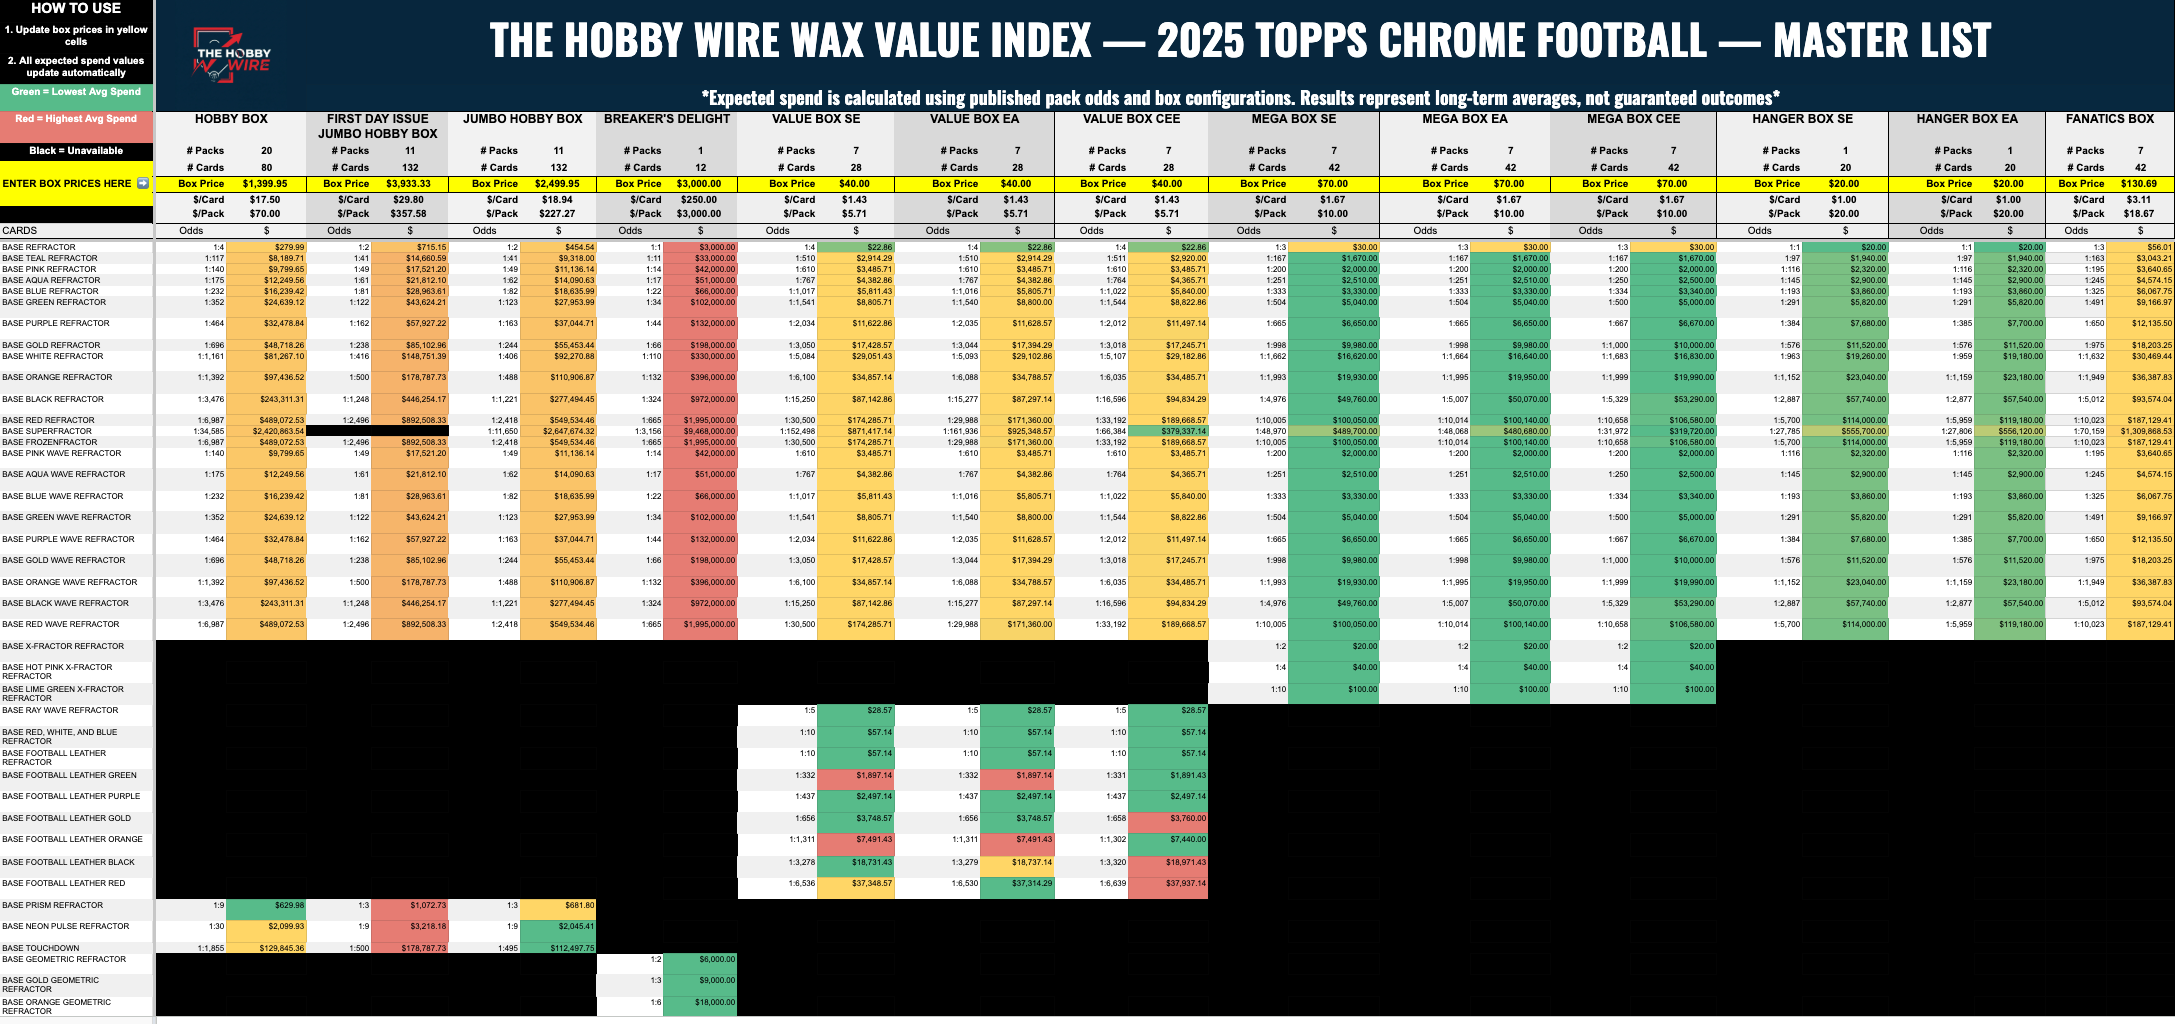
We built a dynamic spreadsheet that calculates the average spend required to pull specific parallels, inserts, and hits across every available format.
The odds never change. But prices do. And that's where this gets interesting.
How the Index Works
The Wax Value Index uses published pack odds and box configurations to calculate the long-term average spend required to pull a specific card in each format.
We factor in the stated odds.
We account for pack counts per box.
We apply current box prices.
The sheet calculates the expected average spend for each type of card automatically across every format.
This isn’t a guarantee. It’s long-term probability. Variance is always in play.
But over time, the math tells a story.

To use the Index, update the box prices in the highlighted cells. The expected spend values and color rankings will adjust automatically.

🟢 Green — lowest average spend for that card
🔴 Red — highest
⬛ Black — not available in that format
SKU Codes
Some Topps odds sheets include multiple SKU codes to describe different distribution channels. On the odds sheet — and in our Index — you might see:
CEE - These boxes are used for specific retailers, often Walmart
SE (Special Edition) - These boxes are sold directly through Topps online
EA - This generally refers to retail products found in stores like Target
The odds between these formats aren't identical. Sometimes the differences are minor. Sometimes they're significant enough to change which format makes the most sense for what you're chasing. The Index makes that easy to see at a glance.
The Bottom Line
We make this tool because collector’s deserve better than guesswork. Box prices shift. Secondary market values move. What looked like the smart format in week one might not be the smart format in week four.
The Index keeps pace with that. Update the prices, run the math, and you’ll have a clearer picture of where your dollar actually goes the furthest. That’s not a guarantee of a hit — it’s just a sharper way to decide how to chase one.
We’ll link back to this primer with every release we cover. Bookmark it, share it with your group chat, and let us know in the comments if something isn’t making sense. This tool gets better the more people use it.
Disclaimer: The content in The Hobby Wire is for informational and entertainment purposes only. Commentary, analysis, and opinions on sports cards, rookies, and the hobby are not financial, investment, or professional advice. Collectors should always do their own research before buying, selling, or trading cards. Market values are volatile and can change rapidly—past performance is not a guarantee of future results.
Unless specified, all pricing references are based on the Prizm/Refractor parallels of an athlete’s Chrome rookie card, with prices from market movers, alt.xyz & 130pt.com.
Any odds mentioned were derived from DraftKings Sportsbook.